Found and tested a fix for a vLLM bug
Repeated-token replies fell from 29 to 0 in our 385-reply MTP-1 comparison on vLLM 0.28.
Read the investigation →RadianVector combines workload-specific evaluation with inference engineering. Our tools compare task results with response time, resource use and serving behavior.
Engineering expertise at RadianVector draws on prior work training AI models at Yahoo Research, building distributed training infrastructure on GPUs owned and operated by Uber, and running simulation-based evaluations for the verification and validation of self-driving systems at Aurora Innovation.
Our published tests found a vLLM bug that changed answers when several requests ran at once. We traced it to the model runner, tested a fix and reran the comparisons.
Repeated-token replies fell from 29 to 0 in our 385-reply MTP-1 comparison on vLLM 0.28.
Read the investigation →Completion time rose under load while generation time changed little. The tool report showed how many requests were running and waiting.
Inspect the observed data →The same SGLang server gave different throughput with the shared benchmark client and its native client and endpoint.
See the engine comparison →Use the same workload to compare configurations. The tools report completed tasks, failed cases, response times and resource use under the tested conditions.
Compare task scores, successful completions and important failures against the same requirements.
Measure time to first token and full task completion. Report typical and slow responses under the tested load.
Count the resources used across the full run, including unsuccessful work. Compare cost alongside task success.
More reasoning, a different model or a serving change can affect all three. The measurements show whether the change is useful for your tasks and budget.
Our published Qwen3.8-27B study measured answer changes and a loss of up to 11.9 short-answer accuracy points with vLLM MTP speculative decoding. We traced an output-correctness bug to the model runner and tested a patch with the same controls before and after the change.
RadianVector compares a feature with the same server without it, token by token. Measured alone, MTP passed. With 16 other requests running it failed: the model’s scores moved by up to 22 nats, where batching alone moved them by at most 0.25.
Replies with a repeated token, and controls that switched off one trigger at a time, traced the cause to vLLM’s V1 model runner: each request’s count of accepted tokens was remapped twice when the batch reordered, so requests resumed from the wrong saved state.
A small change to one source file, then the same tests again: the repeated tokens disappeared, and our equivalence checks judged MTP equivalent to running without it, under load.
MTP depth 1 · Qwen3.8-27B · vLLM 0.28 · on the RTX 4090 GPU family
Plan comparisons around API limits, server capacity and an experiment budget. Keep model identifiers, settings, workload and operating conditions with each result.
Use the same tasks and requirements across candidates. Compare answer quality with response time and resource use.
Record achieved concurrency, accepted settings, cache capacity and server-side events alongside client measurements.
Process independent tasks concurrently and collect results as they arrive. Keep request rates within API limits and match concurrent load to server capacity.
Repeat the relevant checks after a configuration or code change. Preserve run conditions and failure examples with the result.
Agree the tasks, comparisons and required outputs before an evaluation. The public examples below show original tool reports and measured results from our inference tests.
Task scores, completed cases and comparisons with the baseline, using the same requirements.
Which answers improved or regressed?
Answer results beside response-time distributions and resource or API costs for the tested workload.
What does each configuration trade off?
For supported self-hosted runtimes, inspect concurrency, queueing, KV-cache use and server events.
Where does time or memory go?
Keep failed tasks and output differences with the model, settings and run conditions needed to investigate them.
What breaks, and under which conditions?
Keep model identifiers, prompt versions, accepted API or serving settings and the validation results for each candidate.
What settings produced the result?
inferlint is an open-source component of the RadianVector stack for inspecting inference-server behavior.
These measurements were generated by a RadianVector tool during a 27B model concurrency test on vLLM 0.28, with speculative decoding off.
Swipe to see all columns.
| Requests open | Running | Wait for first token median / mean |
Time to completion median / mean |
Slowest | Time generating median |
|---|---|---|---|---|---|
| 1 | 1 | 0.05 / 0.08 | 4.8 / 4.8 | 5.2 | 4.8 |
| 2 | 2 | 0.13 / 0.13 | 5.3 / 5.3 | 5.3 | 5.2 |
| 4 | 4 | 0.11 / 0.11 | 5.5 / 5.5 | 5.5 | 5.4 |
| 8 | 8 | 0.11 / 0.12 | 5.6 / 5.6 | 5.6 | 5.5 |
| 16 | 10 | 3.1 / 3.1 | 8.7 / 8.8 | 11.8 | 5.8 |
| 32 | 10 | 11.8 / 10.8 | 17.6 / 16.6 | 23.5 | 5.8 |
At 8 open requests, mean completion time was 5.6 s. At 32, it was 16.6 s, even though median time spent generating changed only from 5.5 s to 5.8 s. Only 10 of the 32 requests were running; the others were waiting in line.
RadianVector’s inferlint measured what each server actually ran under the same load. The results below show KV capacity, achieved concurrency, request interruptions and output rate.
Swipe to see all columns.
| Measurement | vLLM 0.30 | SGLang 0.5.20 | TensorRT-LLM 1.3.0rc29 |
|---|---|---|---|
| KV pool | 32,336 tokens (47,888 on a second start) | 32,096 tokens | 37,760 tokens |
| Most running at once (T8) | 32 | 29 | 32 |
| Preempted (T1) | 3 preemptions, no log line | 0 retractions | 0 pauses in its log |
| Output tokens per second | 1,274 | 799 | 1,389 |
| Client and server counts (T15) | agree | agree | agree |
The benchmark path matters. With vllm bench serve sending the same load to all three engines, SGLang ran up to 29 requests at once and produced 799 output tokens/s. With SGLang’s own client using its native /generate endpoint, the same server ran all 32 requests and produced 1,337–1,342 output tokens/s. Run details →
Inspect an example report and the published studies. Each shows how a measurement is connected to its workload, configuration and operating conditions.
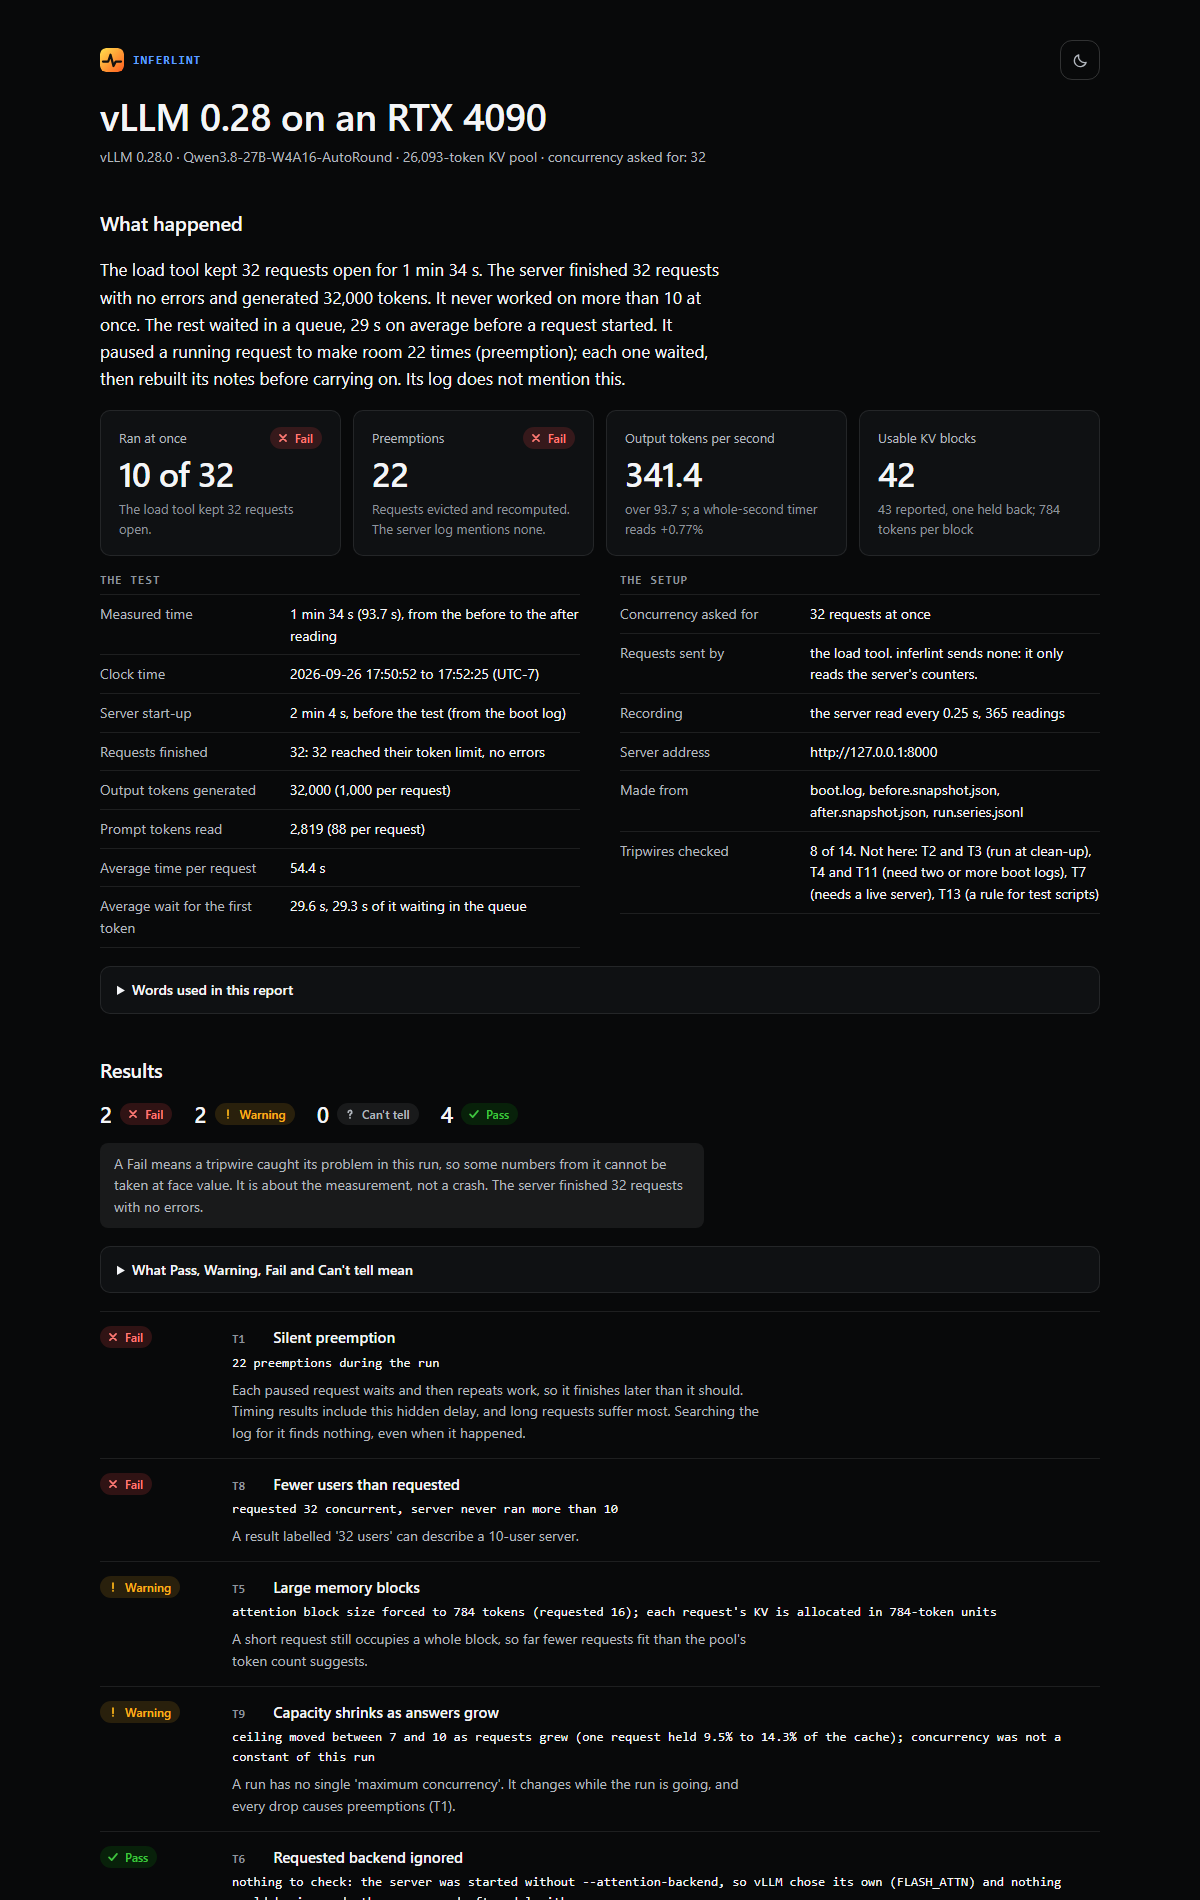
inferlint reads server logs, metrics and GPU process state, then generates reports showing achieved concurrency, queueing, KV-cache use, preemptions and teardown for vLLM, SGLang and TensorRT-LLM.
Explore the tool →A fixed set of 380 code-scored tasks used in RadianVector’s published studies. Company-specific evaluations use the company’s own workload and scoring requirements.
Read about the evaluation set →Published Qwen3.8-27B studies on the RTX 4090 GPU family examine serving configuration and reasoning effort, with operating conditions and results attached.
Read the benchmarks →Plan comparisons around runtime compatibility, hardware and workload requirements. The open-model diagrams illustrate how candidates can be narrowed and tested.
Explore the comparison workflow →Tell us how your team uses AI today. We will work out with you what is worth measuring, then run it with these tools.
Reach out and send us a note. We’ll take it forward from there.